

Like a gemstone cut into many facets, THCA has taken on different shapes across the emerging cannabinoid market – from cured flower and live resin to tinctures, capsules, and infused edibles – and each form catches the light (and the price) differently. As consumers and retailers navigate this evolving landscape, understanding how product type and brand influence what you pay has become as critically importent as knowing what you’re buying.
this article maps current THCA market values by product category and brand, unpacking the variables that drive price differences: formulation and processing costs, laboratory testing and openness, brand positioning and marketing, regulatory burdens, and shifting supply-and-demand dynamics. We’ll compare typical price ranges, highlight where premiums tend to emerge, and explore how brand reputation and product format intersect to shape retail pricing.
Neutral and data-focused,the analysis aims to equip readers-whether industry professionals,curious consumers,or market observers-with a clearer view of the economic logic behind THCA pricing. Expect practical insights grounded in market evidence, plus pointers on what to look for when assessing value across different THCA product types and brands.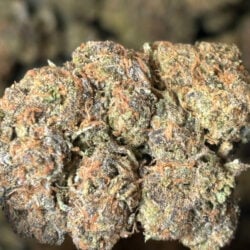
Mapping the THCA Marketplace: Price Patterns Across Flowers, Concentrates, Vapes, and Edibles
Flower still anchors the market - its pricing is read like a map of cultivation choices. Small-batch,craft-grown lots command a premium per gram because of labor,unique terpene profiles,and limited runs,while larger commercial grows bring down the cost in the budget tier. Seasonal harvests and cultivar hype can push mid-tier blooms into luxury pricing for short windows, making per-gram averages fluctuate more than other categories.
Concentrates and vapes show a different logic: consumers pay for potency, purity, and extraction method as much as brand recognition. Solventless waxes and live-resin products typically fetch higher prices than distillates, while vape cartridges are judged on consistency and packaging. Key pricing drivers include:
- Extraction technique (rosin, CO2, BHO)
- Potency (% THCA/THC) and terpene content
- Brand reputation and GMP-style packaging
Edibles are priced by dose rather than weight, which makes per-milligram comparisons the clearest way to gauge value. Premium producers who emphasize microdosing formulas, unique flavor profiles, or slow-release technologies will mark products above commoditized gummies. Retail math here is simple: predictable dosing plus clear labeling tends to stabilize prices, while novelty formats (beverages, chef-crafted confections) increase variance.
| Product Type | Typical Unit | Common Price Range (USD) | Brand Premium |
|---|---|---|---|
| Flower | per gram | $5 – $25 | 10-50% |
| Concentrates | per gram | $20 – $70 | 15-60% |
| Vape Cartridges | 0.5-1 mL | $20 – $60 | 20-80% |
| Edibles | per 10-50 mg dose | $2 – $10 per dose | 5-40% |
Brand Premiums and Value Signals: How Reputation, Testing, and Packaging Move Prices
Brands that have cultivated a clear identity and consistent quality extract a visible premium in the THCA market. Consumers rarely buy potency alone – they buy a story: heritage growers, curated cultivars, and a promise of repeatable effects. that narrative becomes a pricing lever.When a label consistently delivers what its marketing promises, retailers and consumers both treat the product as a safer, higher-value choice, and that perceived safety translates to higher shelf prices and longer-standing trust.
Objective proof compounds reputation into hard dollars. Third‑party lab reports, accessible Certificates of Analysis (COAs), and obvious batch traceability turn intangible trust into measurable signals that justify markups. Sellers who make coas easy to find or embed QR access on packaging see less friction at point-of-sale and often command stronger margins.
- COA/QR access – verifies potency & contaminants
- Terpene profiles – communicates flavor and effect nuances
- Limited runs & batch numbers – create scarcity premiums
- Premium packaging – elevates perceived quality and giftability
Packaging and presentation act as the final nudge that converts a curious browser into a buyer. Clean typography, tactile materials, and functional design (child safety, resealability) not only protect the product but also signal professionalism. Below is a simple snapshot of common value signals and their typical impact on price.
| Signal | Why it matters | Typical price Shift |
|---|---|---|
| Reputation | Trust and repeat purchase likelihood | +10-40% |
| Lab Testing | Objective quality proof reduces buyer risk | +5-20% |
| Packaging | Shelf appeal and perceived premium | +3-15% |
ultimately, premiums are additive and sometimes multiplicative: a well-known brand that publishes COAs and invests in standout packaging will command a far steeper price than any single signal would predict.For emerging brands, the practical play is to prioritize the most efficient signals – transparent testing and thoughtful packaging – to punch above their size and capture a meaningful share of premium pricing.

Regional and Regulatory Influences on THCA Pricing: What Local Markets Reveal
Local regulation often writes the price tag. Where municipalities allow adult-use storefronts and streamlined licensing, THCA tends to trade at narrower margins; where municipalities ban retail or impose heavy excise taxes, the same product can cost considerably more. Testing protocols, packaging mandates, and waste-disposal rules are invisible line items that show up on receipts – lab fees and single-use packaging add up, and those costs get passed downstream. Cultural demand matters too: tourist-heavy regions with high foot traffic can support premium, branded THCA offerings, while smaller medical markets favor concentrate and value SKUs.
Supply-chain friction is another local sculptor of price. interstate prohibition forces producers to localize cultivation, increasing per-unit costs in high-rent areas. Conversely, regions with established hemp processing or large-scale craft cultivators can undercut newcomers by achieving economies of scale. Local enforcement intensity also matters: areas with frequent sweep-and-seizure actions push product into informal channels that may reduce retail prices but increase risk and variability in potency and labeling. Key drivers found repeatedly in regional markets include:
- Taxation and excise structure - flat vs. percentage rates change retail math
- Testing and compliance costs - mandatory potency and contaminant screens
- Distribution limits - caps on retail outlets or transport restrictions
- Market maturity – established brands vs. fragmented local producers
Reading local price maps reveals predictable patterns: tightly regulated, high-demand metros command brand premiums; permissive, production-rich states show volume discounts. The simple table below sketches typical ranges and the dominant regulatory pressure in four archetypal markets - a speedy reference for brands planning expansion or consumers tracking value.
| Region Type | Typical Price/gram | Dominant Regulatory Pressure |
|---|---|---|
| Coastal Metro (mature) | $12-$18 | High taxes + strict testing |
| Production Hub (supply-rich) | $6-$10 | Scale + light local retail limits |
| Tourist Corridor | $14-$22 | Premium branding + seasonal demand |
| Restrictive market | $10-$20* | limited outlets + informal channels |
Breaking Down Cost Drivers: Input, Extraction, Compliance, and Retail Margins
Price tags in the THCA marketplace are a mosaic of tangible costs and invisible premiums. Grower decisions – from seed selection to light cycles – set the baseline, but what really shifts dollar signs is how product moves through processing, testing, and the hands that finally sell it. Small changes in yield or batch loss can ripple into significant per-unit swings,while the choice of extraction method can turn a modest flower margin into a high-cost concentrate proposition.
Major drivers that consistently show up on invoices and spreadsheets include:
- Inputs: genetics, nutrients, power and labor - the raw ingredients of cultivation that determine baseline quality and cost.
- Processing & Extraction: equipment amortization, solvent or CO₂ costs, technician time and lost yield during concentration.
- Compliance & Testing: lab fees, labelling, batch tracking and waste-handling protocols required by regulators.
- Retail & Distribution: wholesale discounts, dispensary margins, marketing spend and logistics that convert product into a sale.
| Product | Input % | Extraction % | Compliance % | Retail % |
|---|---|---|---|---|
| Flower (bulk) | 45% | 0% | 15% | 40% |
| Cartridges | 25% | 30% | 15% | 30% |
| Distillates & Extracts | 20% | 40% | 15% | 25% |
Beyond raw percentages, the story of price is often written by brand positioning and scarcity. Premium packaging,batch-specific marketing,limited genetics,or vertically integrated quality control can justify a higher tag even when underlying costs mirror commodity offerings. For buyers and sellers alike, the smart move is to isolate the controllable pieces - yield, extraction efficiency, and compliance workflow – while recognizing that brand and distribution strategy frequently determine whether a product competes on cost or on perceived value.
Pricing Strategies for sellers and Smart Buying Tactics for Consumers
Sellers can shape perceptions as much as margins – pricing is storytelling. Position high-potency concentrates and limited-run strains as premium experiences and use price anchoring with a flagship product to make mid-range offerings feel like bargains. Tiered pricing by format (flower, isolate, tincture) tied to clear potency and lab-data cues helps buyers understand the value differential; merchants who show a deliberate value-per-mg equation earn repeat customers faster than those hiding markups behind jargon.
Shrewd shoppers look beyond sticker price. Compare products by potency and purity - calculate mg-per-dollar, review the product’s certificate of analysis (COA), and favor brands with consistent third-party testing.Timing matters: watch for post-harvest clearance, subscription discounts, and bundled offers where the effective cost per dose drops dramatically. When in doubt, prioritize transparency and consistency over novelty.
Smart inventory moves tie both sides together: dynamic promotions (limited-time bundles, loyalty rewards, and seasonal markdowns) keep supply turning without eroding perceived quality. Small, predictable discounts for repeat customers or volume purchases preserve margins while raising lifetime value. conversely, sudden deep price slashes on flagship items can damage brand trust - implement targeted markdowns with clear messaging about why the price changed.
Simple heuristics reduce buyer regret and seller confusion alike. Keep pricing language plain, offer clear potency-to-price comparisons, and use short-term promotions to test elasticity. Below are quick actionables for each side:
- Sellers: bundle low-turn SKUs with popular items; post COAs; test anchor pricing on new releases.
- Consumers: compute mg-per-dollar, buy during harvest sales, and subscribe for steady savings.
| Product Type | Typical Price/gram | Quick Tip |
|---|---|---|
| High-potency Concentrate | $30-$60 | Anchor as premium; offer sampler packs |
| Flower (top-shelf) | $10-$20 | Highlight terpene/C OA; limited releases |
| Isolate/Tincture | $0.10-$0.50 per mg | Sell by potency; bulk savings for regulars |
Forecasting Value: Short Term Trends and Long term Investment recommendations
Near-term price action is likely to be governed by inventory cycles, promotional calendars and regulatory announcements. Concentrates and extracts have shown quicker responsiveness to consumer trends – a single viral product can tighten margins and lift brand premiums within weeks – while raw flower prices move more slowly, tied to harvest seasons and wholesale carry.Expect modest volatility over the next 3-6 months: tactical buying opportunities will appear when seasonal supply peaks depress spot prices, but those windows often close fast.
For investors, balance immediate agility with structural thinking.Consider:
- Speculative traders: focus on short-duration plays in high-liquidity SKUs and track promotional cadence.
- Growth investors: prioritize brands with vertical integration, repeat purchase rates, and SKU diversification.
- Conservative holders: lean into product types with consistent margins (e.g., standardized tinctures) and proven distribution channels.
Diversify across product formats to smooth return profiles - brand equity often outperforms single-hit products over a multi-year horizon.
Relative forecasts by product and brand reveal where value concentrates. The tiny table below condenses a panorama of short-term movement versus a three-year structural stance – an at-a-glance toolkit to align trading tempo with portfolio posture.
| Product Type / Brand | 6‑Month Trend | 3‑Year Outlook | Recommended Stance |
|---|---|---|---|
| Concentrates (CraftCo) | Up 2-6% | Moderate growth | Buy on dips |
| Raw Flower (Heritage farms) | Flat to -4% | Steady demand | Hold |
| Tinctures (PureLine) | +1-3% | High resilience | Core position |
| Pre-rolls (DailyRoll) | -2-0% | Consolidation risk | Selective |
Keep eyes on a short list of leading indicators: inventory days on hand, promotional intensity, wholesale bid-ask spreads, and regulatory policy shifts. These signals tell you when a short-term anomaly aligns with a durable competitive advantage – that’s the moment to convert tactical gains into long-term positions. Risk is reduced not by prediction but by disciplined monitoring and nimble rebalancing.
The Way Forward
as the THCA landscape continues to unfurl, price tags do more than reflect cost – they tell a story about product type, brand positioning, and the invisible variables consumers value: purity, potency, processing, and trust. Whether comparing raw flower,distillates,cartridges,or edibles,remember that disparities in pricing often mirror differences in extraction methods,lab verification,and the reputational currency a brand has earned.
For shoppers and industry watchers alike, the clearest takeaway is this: price is a signal, not the whole story. Look beyond sticker shock to lab results, ingredient lists, and production practices; weigh convenience against concentration; and calibrate expectations to how you prioritize safety, transparency, and performance.
Markets evolve, regulations shift, and consumer tastes pivot – so keep checking figures, read the fine print, and let informed comparisons guide your choices. The numbers on a shelf are just the beginning; know what you’re buying, and the value will follow.